The linkage between foreign direct investment and trade openness in the Russian economy: an ARDL bound testing approach


Abstract
This study examines the relationship between foreign direct investment (FDI), trade openness, and economic growth in Russia using annual time series data from 1993 to 2022. Utilizing the Autoregressive Distributed Lag (ARDL) approach, the findings reveal that FDI and trade have positive short-term effects on economic growth but no significant long-term impact. Supporting variables such as the real effective exchange rate positively influence growth in both the short and long term, while youth unemployment shows mixed short-term effects and a consistently negative long-term impact. Military spending has no short-term effect but negatively impacts growth in the long term, whereas inflation exhibits both positive and negative short-term influences and a negative long-term relationship with growth. Granger causality analysis highlights a unidirectional relationship between economic growth and trade openness, military spending, and the real effective exchange rate. The findings suggest policies to attract sustainable foreign investment, enhance trade, tackle youth unemployment, reassess defense budgets, and maintain stable monetary policies.
Introduction
Foreign direct investment and trade openness are essential components of economic globalization, often regarded as significant drivers of growth, development, and integration into the global economy. For a resource-rich nation like Russia, FDI and trade openness not only stimulate economic activity but also influence its strategic positioning in global trade networks. As Russia seeks to modernize its industries and diversify its economy, these two factors play a central role in fostering international cooperation, advancing economic reforms, and promoting technological progress.
FDI, defined as investments made by foreign entities in a domestic economy, has been a transformative source of capital, expertise, and technology transfer for Russia, especially since the dissolution of the Soviet Union. Following the transition to a market-oriented economy in the early 1990s, Russia actively pursued FDI to modernize its industrial base, improve competitiveness, and support economic development [1; 2]. The energy sector, especially oil and gas, has traditionally attracted the largest share of FDI inflows, significantly contributing to exploration, production, and infrastructure development [3]. However, FDI has gradually expanded into other sectors such as telecommunications, manufacturing, finance, and technology, diversifying the economy and accelerating modernization efforts [4; 5].
Despite these achievements, FDI flows into Russia have been inconsistent, influenced by external shocks, geopolitical instability, and global economic trends [6]. Trade openness, another important pillar of Russia’s economic strategy, is characterized by the degree of a country’s integration into global trade networks. Russia’s accession to the World Trade Organization (WTO) in 2012 represented a major milestone in its efforts to enhance trade liberalization and position itself as a competitive player in global markets [7]. By leveraging its abundant natural resources, skilled labour, and industrial capacity, Russia has aimed to increase trade volumes, attract foreign investment, and diversify trade partnerships [8]. Trade openness has enabled Russia to capitalize on its comparative advantages in resource extraction and energy, while gaining access to new technologies and investment opportunities.
However, FDI and trade openness in Russia face significant challenges. Geopolitical tensions, economic sanctions, regulatory uncertainties, and structural inefficiencies continue to hinder the full realization of globalization’s potential benefits [9; 10]. The COVID-19 pandemic increased these challenges by disrupting global supply chains, reducing export demand, and eroding investor confidence [11]. These issues raise critical questions about how effectively Russia can leverage FDI and trade openness to drive sustainable growth in a volatile global environment.
This study examines the dynamics and impact of FDI and trade openness on Russia’s economic growth. Specifically, it investigates how these factors have influenced GDP per capita and the total economic performance in both the short and long term. Additionally, the study evaluates the role of main variables such as military spending, inflation, and exchange rate fluctuations to provide a comprehensive analysis of the interconnected challenges facing the Russian economy. The underlying hypothesis is that while FDI and trade openness have the potential to stimulate economic growth, their effectiveness may be constrained by domestic factors such as institutional quality, regulatory frameworks, and external economic shocks. By analyzing the trends, challenges, and opportunities associated with FDI and trade openness, this paper seeks to contribute to the understanding of Russia’s economic dynamics within the broader context of globalization. The findings aim to inform policies that enhance the positive effects of FDI and trade liberalization while addressing structural and geopolitical challenges that limit their full potential.
Literature review
The relationship between FDI, trade openness, and economic growth has been widely supported by established economic theories. These frameworks explain how these factors interact to enhance economic performance in Russia. According to neoclassical growth theory, particularly the Solow–Swan model [12; 13], FDI plays a major role in augmenting a country’s capital stock, thereby increasing production capacity and overall economic output. FDI also supplements domestic savings by providing the capital necessary for investment, especially in sectors where domestic resources are insufficient.
In Russia, FDI has significantly contributed to the expansion of capital-intensive industries such as energy and manufacturing. However, the neoclassical model suggests that the impact of FDI on growth diminishes over time due to diminishing returns to capital. Consequently, sustained long-term growth requires continuous advancements in technology, where FDI can serve as a secondary role by facilitating access to advanced technologies and production techniques. Nonetheless, structural and institutional limitations, including regulatory and geopolitical challenges, may restrict FDI’s potential to fully enhance long-term growth in Russia.
In contrast, endogenous growth theory Romer [14] and Lucas [15] provides a more optimistic view of FDI’s long-term impact on economic growth. Endogenous growth models argue that FDI not only increases the capital stock but also promotes innovation and technological progress through spillover effects. Multinational companies investing in Russia bring advanced technologies, managerial expertise, and technical know-how, which can spill over into the local economy, enhancing productivity and fostering sustained growth. However, the effectiveness of these spillovers depends on the absorptive capacity of the host economy. Factors such as human capital, institutional quality, and technological infrastructure are significant in determining the extent of these benefits. Research by Smith and Thomas [16] supports this perspective, showing that FDI positively influences regional innovation in Russia, especially in regions with higher levels of human capital.
Trade openness also supports economic growth by facilitating the exchange of goods, services, and technologies across borders. The Heckscher-Ohlin trade theory posits that trade enables countries to specialize in industries where they have a comparative advantage, thereby increasing efficiency and national income. For Russia, trade openness facilitates the export of natural resources, such as oil and gas, which represent areas of clear comparative advantage. By accessing larger global markets, Russian firms can achieve economies of scale, boosting productivity and economic output. However, an over-reliance on resource exports renders the Russian economy vulnerable to external shocks, such as fluctuations in commodity prices and geopolitical tensions. These vulnerabilities are well-documented in the literature, which emphasizes the importance of economic diversification to mitigate such risks.
The new trade theory by Krugman [17] introduces another dimension by indicating the role of economies of scale and network effects in trade. Trade openness enables domestic firms to access international markets, fostering productivity gains through specialization and increased competition. This theory is relevant to Russia’s manufacturing sector, where firms benefit from exporting to larger markets and importing advanced machinery and intermediate goods. These activities not only enhance domestic production capabilities but also lead to knowledge transfers that support innovation and long-term growth.
The interaction between FDI and trade openness creates a powerful pathway for economic growth. FDI introduces capital and technology, while trade openness grants access to international markets, enabling firms to leverage these resources effectively. Transmission channels such as capital accumulation, technology transfer, and innovation are central to this relationship. FDI increases the stock of capital in the host country, while trade openness facilitates the importation of capital goods and technology, further enhancing productive capacity. In Russia, FDI in capital-intensive sectors and trade in natural resources have played significant roles in economic growth. However, institutional quality and human capital are important in ensuring these benefits are fully realized. Studies have consistently showed that without strong institutions and skilled labour, the potential benefits of FDI and trade openness may remain underutilized.
Trade, FDI, and labour market dynamics in Russia
Russia’s economic framework demonstrates the relationships between its trade dynamics, FDI inflows, trade relations with neighboring regions, and youth unemployment, with each factor influencing and reflecting the others. Exports and imports are vital to Russia’s economic health, significantly affecting its trade balance and growth. As a major exporter of energy resources, including oil, natural gas, and coal, Russia generates a substantial portion of its revenue from these sectors [18—20]. Supported by vast reserves and an extensive pipeline infrastructure, this reliance on energy exports positions Russia as a global energy leader. Recent efforts to diversify exports into non-energy sectors, such as aerospace, automotive, machinery, and technology, aim to reduce dependence on commodities and enhance economic stability [21].
Conversely, Russia’s imports consist of goods and services essential for industrial modernization and consumer needs, including technology-intensive products and agricultural goods [22; 23]. The import of machinery and equipment is important for supporting industrial production and infrastructure development.
FDI inflows into Russia are influenced by economic, political, and institutional factors. Factors such as market size, natural resource availability, infrastructure, and macroeconomic stability support the roles in attracting FDI [24]. However, geopolitical tensions and sanctions especially after the events in Crimea in 2014, have led to a decline in Western investment [25; 26]. For example, FDI fell to approximately $ 18 billion in 2022 [27], reflecting diminished investor confidence. This trend is further exacerbated by high youth unemployment rates, which signal economic inefficiencies and structural challenges that deter potential investors. High youth unemployment often reflects a mismatch between educational outcomes and labour market demands, reducing the labour market’s attractiveness to foreign investors [28; 29].
Russia’s trade with the Baltic states (Estonia, Latvia, and Lithuania) shows the interconnected nature of its economic factors. Historically, the Baltic states have been significant importers of Russian energy resources. However, efforts by these countries to diversify their energy sources and reduce reliance on Russian imports have altered this relationship [30;31]. Investments in renewable energy and infrastructure by the Baltic states have reduced Russia’s energy export revenues, influencing its trade balance and FDI attractiveness. Despite ongoing Russian investments in sectors like real estate, finance, and retail within the Baltic region [32], political tensions and sanctions have periodically disrupted these economic connections. Additionally, tourism and transportation networks that facilitate trade between Russia and the Baltic countries have been affected by geopolitical factors, further impacting trade flows and investment opportunities [33; 34]. The integration of the Baltic countries into the EU and NATO has diversified their trade partnerships, reducing their reliance on Russia, although economic ties remain significant [35].
Youth unemployment in Russia adds another layer of complexity to these economic dynamics. High unemployment rates among young people reflect structural problems in the labour market, such as a mismatch between education and job market demands. This mismatch limits domestic consumption and reduces demand for imports, including technology-intensive products essential for industrial modernization [36]. The informal sector further complicates the labour market by trapping many young workers in low-quality jobs without social protections [28]. Regional disparities exacerbate these challenges, with urban centres like Moscow and St. Petersburg providing better job prospects compared to rural areas, leading to uneven economic development and higher youth unemployment in less-developed regions [29; 36]. Addressing these challenges requires targeted labour market reforms and education initiatives to promote sustainable employment opportunities [37]. The connections between Russia’s trade patterns, FDI trends, and youth unemployment illustrate the interdependent nature of these factors. Each element shapes and is shaped by broader economic and geopolitical forces, emphasizing the importance of addressing these challenges in a coordinated manner.
Challenges of the Russian economy
Economic sanctions imposed by Western countries, following the events in Crimea in 2014 and the intensification of the conflict between Russia and Ukraine in 2022, have had substantial effects. These sanctions have restricted access to international capital markets, advanced technology, and foreign investments, further isolating the economy [38]. Additionally, Russia’s heavy reliance on natural resources, especially oil and gas, exposes the economy to fluctuations in global commodity prices. This dependence undermines efforts to diversify and reduces long-term sustainability [39]. Recent efforts by European countries to reduce reliance on Russian energy have further disrupted revenue streams and export dynamics.
Structural weaknesses also pose significant barriers to economic growth. Inefficiencies, excessive bureaucracy, and a lack of institutional reforms deter foreign investment and hinder domestic economic activity [40]. Demographic challenges remain a critical concern. An aging population and declining birth rates continue to strain social security systems and reduce labour force participation. These issues are compounded by recent emigration trends, driven by geopolitical tensions and military mobilization policies, leading to the loss of skilled workers and further risks to long-term productivity [27; 41].
The technological gap is another pressing issue. Limited investment in research and development, combined with restricted access to modern technologies due to sanctions, has slowed Russia’s progress in digitalization and innovation [42]. This gap significantly reduces the competitiveness of Russian industries and hinders the transition to a knowledge-based economy.
Income inequality continues to widen, fueled by the concentration of wealth among a small elite. This unequal distribution of resources undermines social cohesion and limits broader economic growth potential [43]. Moreover, geopolitical tensions and ongoing military conflicts have introduced significant economic uncertainties. These factors disrupt trade relationships and foreign investments while increasing fiscal pressures due to higher defense spending and the economic costs of prolonged conflict [27; 40].
Empirical review
The relationship between FDI, trade openness, and economic growth has been widely examined from the perspective of emerging economies, including Russia. Iwasaki and Suganuma [44] analyzed the impact of FDI on productivity across Russian regions before and after 2003. Their findings revealed that regions with higher FDI inflows experienced productivity gains, emphasizing the importance of foreign investment in boosting regional economic performance. This research indicates the transformative role of FDI in Russia’s development, although recent geopolitical changes and sanctions have introduced complexities not covered in the study.
Burange et al. [8] examined trade openness and economic growth in BRICS nations. While their findings identified export- and import-led growth for China and South Africa, they found no clear causal relationship between trade openness and growth in Brazil and Russia. This result emphasizes the need for further investigation into how trade openness affects economic performance in Russia, given its reliance on resource exports. Similarly, Shah and Khan [45] analyzed trade liberalization and FDI inflows in six emerging economies, including Russia. Their study emphasized that reducing barriers to trade and investment can attract FDI and foster economic growth.
Mariev et al. [46] explored FDI patterns in Russia, finding that larger developed economies tend to ‘overinvest’, while smaller or less developed nations ‘underinvest’. This suggests that FDI inflows into Russia are driven by both economic size and strategic considerations. Arman et al. [47] studied trade openness among Central Asian countries and found that more open economies benefited from reduced trade costs, while less open nations relied heavily on resource exports. Their findings show how trade openness can shape regional economic dynamics, a factor also relevant to Russia’s trade patterns. Guris and Gozgor [48] explored the role of trade openness in attracting FDI to Turkey. Their findings demonstrate that greater trade openness fosters FDI inflows by reducing barriers and improving market access. While these results are applicable to emerging economies, Russia’s geopolitical and institutional factors, including sanctions, create a more complex environment for trade and investment interactions.
Gusarova [49] investigated BRICS nations’ potential to drive global economic growth through trade and investment cooperation. The study indicates China’s dominant role as an investor and the contributions of intra-BRICS trade to economic development. However, the evolving role of Russia within BRICS, under the pressures of sanctions and geopolitical tensions, remains less explored. Rani and Kumar [50] examined the relationship between trade openness, capital formation, and growth in BRICS nations, concluding that trade openness significantly influences economic growth. Their findings indicated the importance of global trade integration, but do not fully address the specific challenges Russia faces, such as institutional weaknesses and political risks.
Smith and Thomas [16] analyzed the relationship between FDI and innovation in Russia, demonstrating that FDI positively impacts regional innovation. Their research emphasizes the role of absorptive capacity, such as human capital and institutional quality, in maximizing the benefits of FDI. Similarly, Kaneva and Untura [51] indicated the importance of FDI and imports in promoting regional development through knowledge spillovers. These studies emphasize the significance of FDI for technological advancement and regional economic growth in Russia.
Farhad et al. [52] focused on energy trade patterns between Russia and the Asia-Pacific region, revealing a positive relationship between export flows and economic growth. This finding illustrates the centrality of energy exports in Russia’s economy but does not address how FDI and trade openness interact with the energy sector under global economic and political pressures. Nepal et al. [53] examined energy security, FDI, and economic output in India, finding strong long-term relationships between energy use, carbon emissions, and economic growth. Although this research is relevant for energy-exporting countries, its applicability to Russia requires consideration of the unique challenges posed by sanctions and institutional constraints.
Cheon et al. [54] explored the effects of trade openness on environmental quality in the CIS region, finding a dual effect on CO2 emissions: trade openness increases emissions but also reduces them indirectly by raising per capita income. While this environmental perspective adds depth to understanding trade openness, it does not explore its relationship with FDI and economic growth in Russia.
In a broader empirical perspective, Sadia et al. [55] explored the role of trade openness, inflation, FDI, and other macroeconomic factors in Pakistan’s economic growth. Khan and Nawaz [56] similarly examined the impact of trade and FDI on income inequality in CIS countries. Although these studies are beneficial, their findings may not translate directly to Russia, given the different institutional and geopolitical environments.
Although substantial empirical research exists on FDI and trade openness, gaps remain in understanding Russia’s unique case. Existing studies often focus on economic drivers without fully addressing the impact of geopolitical risks, sanctions, and institutional challenges. This study aims to bridge these gaps by analyzing how economic and non-economic factors collectively influence Russia’s economic growth. By doing so, it seeks to provide a more comprehensive understanding of the dynamics shaping FDI, trade openness, and growth in Russia.
Materials and methods
Data source
This study utilized annual time series data obtained from the World Development Indicators (WDI) database, covering the period from 1993 to 2022. The selected variables include GDP per capita, youth unemployment rate, trade openness, military spending, real effective exchange rate, inflation rate, and FDI inflows. GDP per capita is measured in thousands of United States dollars (USD). The youth unemployment rate is expressed as a percentage (%), representing the proportion of the youth labour force that is unemployed. Similarly, the inflation rate is expressed as a percentage (%), reflecting the annual percentage change in the general price level of goods and services. The real effective exchange rate is presented as an index, measuring the value of a country’s currency relative to a basket of foreign currencies, adjusted for inflation differentials.
Trade openness is calculated as the ratio of total trade (exports plus imports) to gross domestic product (GDP), reflecting the degree of a country’s integration into international trade relative to its economic size. Military spending and FDI inflows are expressed as ratios to GDP, indicating the proportion of economic output allocated to military expenditures and the proportion contributed by foreign investments, respectively.
Figure 1 illustrates the trends of the selected economic and social indicators from 1995 to 2020. GDP per capita shows consistent growth over time, with a significant increase between 2005 and 2015, followed by a slight decline prior to 2020. Inflation experienced a sharp decline during the late 1990s, stabilizing at low levels in subsequent years. Military spending remained relatively stable, with minor fluctuations and a peak around 2015. FDI inflows exhibit significant volatility, with peaks in the early 2000s and subsequent fluctuations. The real effective exchange rate displays an upward trend, despite occasional declines, especially during 2008. Trade openness peaked in the late 1990s but declined consistently thereafter. Lastly, youth unemployment decreased substantially after 1995, reaching its lowest level around 2007, before showing some variability in the following years and stabilizing after 2010.
Fig. 1. Trends of the variables in Russia (1993—2022)
Theoretical framework and model specification
The theoretical framework guiding this study is rooted in economic theories that explain the dynamics of Russia’s economy. It posits that Russia’s economic performance and development are influenced by the interaction of factors, including GDP per capita, youth unemployment rate, trade openness, military spending, real effective exchange rate, inflation rate, and FDI. These factors collectively both shape and are shaped by Russia’s unique economic and geopolitical conditions. GDP per capita is employed as the primary indicator of economic performance and living standards. It reflects the average income of the population and serves as a measure of aggregate economic activity. Theoretical perspectives, such as those by Mankiw et al. [57], suggest that higher GDP per capita is associated with improved economic conditions and living standards, which in turn interact with other variables like trade openness and FDI.
The youth unemployment rate is included to assess the impact of economic and trade policies on Russia’s younger workforce. High youth unemployment often signals economic inefficiencies and labour market challenges, which can hinder economic growth and stability. Theoretical understanding from Blanchard and Johnson [58] emphasizes the significant implications of elevated youth unemployment for economic performance and social cohesion. Trade openness measures Russia’s engagement in international trade relative to GDP. This variable is critical for understanding how trade policies affect economic growth and development. Economic theory, such as the work of Frankel and Romer [59], suggests that increased trade openness enhances growth by providing greater market access and attracting foreign investment. This is especially relevant for Russia, given its reliance on energy exports and its efforts to diversify its economy.
Military spending is examined to evaluate its effects on economic performance and trade dynamics. While the relationship between defense expenditures and economic growth is complex, military spending can influence national budgets, infrastructure investments, and total economic stability. The defense-economic growth nexus, as discussed by Barro [60], provides details on how military expenditures interact with other economic variables in the Russian economy. The real effective exchange rate captures the relative value of the Russian ruble against a basket of foreign currencies, adjusted for inflation. This variable is crucial for assessing trade competitiveness and inflationary pressures. Theoretical models, such as those by Dornbusch [61], show the significant impact of exchange rate fluctuations on export competitiveness and trade balance.
The inflation rate represents the aggregate increase in price levels within Russia. It is an important variable for understanding how inflation affects economic stability and trade. High inflation erodes purchasing power and deters investment, while stable inflation is generally associated with economic growth and stability, as noted by Fisher [62]. FDI is included to examine the effects of international investment flows on Russia’s economic growth and development. Theoretical frameworks, such as Dunning’s [63] theory, emphasize the role of FDI in enhancing productivity, transferring technology, and fostering economic growth. This is relevant for Russia’s efforts to attract foreign investment and diversify its economy. To ensure correct econometric specification, the variables were transformed into their natural logarithmic forms before estimation. Based on the theoretical perspective, the model to be estimated is represented in Equation 1.
GDPpct = β0 + β1Yuempt + β2Topt + β3Milspt + β4Reert + β5Inflt + β6FDIt + μt, (1)
where: GDPpct represents GDP per capita; Yunemp denotes the youth unemployment rate; Top stands for trade openness; Milsp indicates military spending; Reer represents the real effective exchange rate; Infl refers to the inflation rate, and FDI is foreign direct investment.
Estimation approach
To investigate both the long-term and short-term relationships among the variables, this study employed the ARDL bounds testing approach introduced by Pesaran et al. [64]. This method is suited for analyzing the connections between FDI, trade openness, and GDP per capita, as these factors significantly influence economic performance. The ARDL model is widely regarded as a robust tool in econometric analysis due to its flexibility and advantages over other methods. One major advantage is its ability to handle variables with different orders of integration, such as I (0) and I (1), without requiring prior differencing. This characteristic ensures that the model is adaptable to diverse datasets while maintaining robustness in the analysis [65; 66].
Equation 2 presents the specific ARDL model formulation used in this study. This specification facilitates a detailed examination of the relationships among the variables, enabling a better understanding of their contributions to economic growth and development over time.
ARDL bound testing for cointegration
In conducting the ARDL bounds test for cointegration, this study adopts the methodology proposed by Pesaran and Shin [71]. This approach employs the Wald statistic within the ARDL framework to evaluate the significance of the lagged coefficients of the variables. The F-statistic, derived from the correlation coefficient in the F-test, is then compared to the critical values for the ARDL cointegration test. These critical values are determined based on the maximum asymptotic spread of the F-statistic and guide the decision-making process regarding the acceptance or rejection of the null hypothesis [64].
Given the relatively small sample size used in this analysis, it is necessary to compare the calculated F-statistic value with the critical thresholds recommended by Narayan [67] for the asymptotic distribution of the F-statistic. This adjustment ensures that the conclusions remain robust and reliable, even when the analysis is constrained by sample size limitations. The expression for the ARDL bounds testing cointegration is presented in Equation 3, summarizing the statistical basis for assessing the presence of cointegration among the variables. This rigorous approach enhances the reliability of the study’s findings and reinforces the validity of the conclusions drawn regarding the long-term relationships among the variables.
-web-resources/image/f_3.png)
The short-run coefficients to be estimated are denoted by symbols like ω, ψ, φ, θ, Ψ, Φ, and δ, while the long-run parameters are represented by λ1, λ2, λ3, λ4, λ5, λ6, ˄ λ7. Cointegration determination hinges on rejecting the null hypothesis (λ1 = λ2 = λ3 = λ4 = λ5 = λ6 = λ7 = 0) against the alternative hypothesis which states that λ 1 ≠ λ2 ≠ λ3 ≠ λ4 ≠ λ5 ≠ λ6 ≠ λ7 = 0. In ARDL bound testing, confirmation of a cointegration relationship occurs when the F-statistic of the estimated model exceeds the highest critical value listed for I (1) or falls below the lowest critical bound for I (0). However, the estimation of an error correction model (ECM) is necessary due to the presence of at least one causal relationship among the variables, as indicated by the F-statistic in the long-run estimation and the lag structure of the model. The short-run dynamics of the variables are derived from the ECM, which complements the long-run estimation by capturing the adjustments toward equilibrium after a short-term shock. The specification of the error correction model is presented in Equation 4.
-web-resources/image/f_4.png)
where ΘEcttf – 1 represents the error correction term to be estimated. The coefficient -web-resources/image/%D0%98%D0%B7%D0%BE%D0%B1%D1%80%D0%B0%D0%B6%D0%B5%D0%BD%D0%B8%D0%B5_611375.png) signifies the rate at which short-run deviations are adjusted toward the long-run equilibrium. According to the criteria of the ARDL error correction model, the error correction coefficient must be negative and statistically significant to confirm the presence of a valid long-run relationship.
signifies the rate at which short-run deviations are adjusted toward the long-run equilibrium. According to the criteria of the ARDL error correction model, the error correction coefficient must be negative and statistically significant to confirm the presence of a valid long-run relationship.
Results
The descriptive statistics in Table 1 provide an overview of the variables within the Russian economy. The mean GDP per capita is $ 8,688, representing the average economic output per person. The standard deviation of $ 799 reflects the degree of variation in GDP per capita over time. Trade openness has a mean value of 52.94 %, indicating the average level of engagement in international trade relative to GDP. The standard deviation of 6.96 % indicates the variability in trade openness across different years or economic conditions. The mean youth unemployment rate is 17.244 %, reflecting the average proportion of unemployed youth within the labour force. A standard deviation of 3.085 % suggests moderate variability in youth unemployment rates across regions or time periods in Russia.
Military spending, as a percentage of GDP, has a mean value of 3.786 %, indicating the average allocation of the country’s economic output to defense expenditures. The standard deviation of 0.558 % points to limited variability in military spending across different budgetary periods. The real effective exchange rate (REER) has a mean value of 4.364, representing the average competitiveness of Russian goods and services in international markets when adjusted for inflation. The standard deviation of 0.237 indicates slight variability in the exchange rate over time or in response to external economic factors. The mean inflation rate is 2.734 %, reflecting the average rate of increase in the general price level of goods and services. The standard deviation of 1.322 % indicates moderate variability in inflation across time or sectors. Finally, the mean foreign direct investment (FDI) inflows stand at 1.687, representing the average level of foreign investment as a percentage of GDP. The standard deviation of 1.359 shows the variability in FDI inflows due to changes in economic policies, external conditions, or geopolitical events.
The correlation matrix results presented in Figure 2 reveal the relationships among the variables. GDP per capita shows a strong positive correlation with FDI, suggesting that higher levels of GDP per capita are associated with increased foreign investment. Conversely, trade openness exhibits a strong negative correlation with both GDP per capita and REER, implying that higher trade openness is generally associated with lower GDP per capita and a less favorable exchange rate. Youth unemployment displays a moderate negative correlation with GDP per capita, indicating that higher unemployment rates among youth are linked to lower economic output per person. Inflation is also moderately negatively correlated with REER, suggesting that higher inflation tends to reduce the competitiveness of Russian goods and services in international markets.
Military spending exhibits a weak negative correlation with youth unemployment, suggesting that increased defense spending may have a slight association with lower unemployment rates among the youth. However, military spending does not show significant correlations with most other variables. FDI demonstrates weak correlations with both GDP per capita and youth unemployment, but these relationships are not strong. Most other variables show limited or no significant correlations with one another.
Table 1
Descriptive statistics
Indicators / Descriptive Statistics | GDPpc | Yunemp | Top | Milsp | Reer | Infl | FDI |
Mean | 8.688 | 17.244 | 52.940 | 3.786 | 4.364 | 2.734 | 1.687 |
Median | 9.063 | 16.410 | 50.755 | 3.760 | 4.384 | 2.498 | 1.735 |
Maximum | 9.678 | 27.090 | 69.390 | 5.430 | 4.688 | 6.773 | 4.500 |
Minimum | 7.193 | 13.640 | 43.770 | 2.730 | 3.871 | 1.057 | − 1.930 |
Std.Dev | 0.799 | 3.085 | 6.960 | 0.558 | 0.237 | 1.322 | 1.359 |
Skewness | − 0.355 | 1.614 | 1.059 | 0.772 | − 0.640 | 1.496 | − 0.056 |
Kurtosis | 1.582 | 5.394 | 3.272 | 4.115 | 2.527 | 4.929 | 3.436 |
Jarque-Bera | 3.143 | 20.182 | 5.704 | 4.535 | 2.329 | 15.845 | 0.253 |
Probability | 0.207 | 0.000 | 0.057 | 0.103 | 0.312 | 0.000 | 0.881 |
Sum | 260.642 | 517.33 | 1588 | 113.5 | 130.9 | 82.03 | 50.63 |
Sum Sq. Dev | 18.517 | 276.16 | 1405 | 9.054 | 1.635 | 50.72 | 53.58 |
Observation | 30 | 30 | 30 | 30 | 30 | 30 | 30 |
Based on World Bank data.
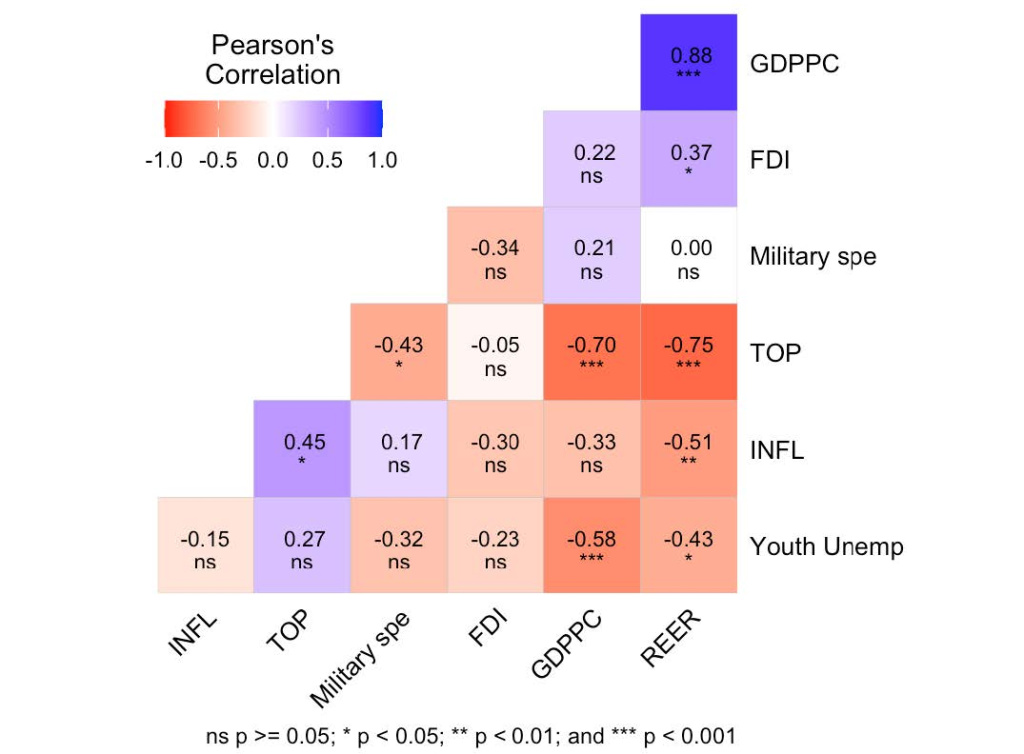
Fig. 2. Pearson correlation coefficients of the variables
Stationarity test
Table 2 presents the results of the unit root tests conducted for seven economic variables: GDP per capita, youth unemployment rate, trade openness, military spending, real effective exchange rate, inflation rate, and FDI. These tests were performed at both the original level of the variables (denoted as I (0) and their first differences (denoted as I (1), utilizing two statistical methods, the Augmented Dickey-Fuller (ADF) test [69] and the Phillips-Perron (PP) test [70]. The stationarity properties of each variable were evaluated based on these tests. The results indicate that GDP per capita and the youth unemployment rate exhibit stationarity after differencing at the 5 % significance level according to both the ADF and PP test statistics. Similarly, trade openness and FDI show evidence of stationarity after differencing, with highly negative test statistics at both levels I (0) and first differences I (1), indicating significance at the 1 % level.
Military spending is stationary after differencing at the 1 % significance level, while the real effective exchange rate achieves stationarity after differencing at the 5 % significance level. Interestingly, the inflation rate appears stationary at its original level I (0) without requiring differencing, as indicated by the ADF and PP test statistics, which show significance at the 1 % level. These findings confirm the varying stationarity properties of the variables and justify the use of the ARDL model, which accommodates variables with mixed orders of integration I (0) and I (1).
Table 2
Results of the unit root test
Variable | Level | ADF | PP |
GDPpc | 0 | − 0.481 | − 0.654 |
DGDPpc | 1 | − 3.623** | − 3.576** |
Yunemp | 0 | − 2.093 | − 2.318 |
DYunemp | 1 | − 4.381*** | − 4.376*** |
TOP | 0 | − 1.716 | − 2.989** |
DTOP | 1 | − 6.680*** | − 8.780*** |
Milsp | 0 | − 2.509 | − 2.570 |
DMilsp | 1 | − 5.047*** | − 5.965*** |
Reer | 0 | − 1.915 | − 1.761 |
DReer | 1 | − 3.820*** | − 3.336** |
Infl | 0 | − 3.755*** | − 5.093*** |
FDI | 0 | − 2.115 | − 1.923 |
DFDI | 1 | − 6.843*** | − 6.853*** |
Significance codes: ***1 %; **5 %.
Based on World Bank data.
ARDL bound test cointegration
Table 3 presents the results of the bound test for cointegration using the ARDL model. The F-statistic for the ARDL bound test is calculated as 9.449. This statistic is compared against critical values at three significance levels (10 %, 5 %, and 1 %) to determine the presence of cointegration among the variables. At the 10 % significance level, the critical values for the F-statistic are 1.99 for I (0) and 2.94 for I (1). At the 5 % level, the critical values are 2.27 for I (0) and 3.28 for I (1). At the 1 % level, the critical values are 2.88 for I (0) and 3.99 for I (1). Comparing the calculated F-statistic of 9.449 to these critical values, it is evident that the F-statistic exceeds all critical values at all levels of significance for both I (0) and I (1).
These results provide strong evidence of cointegration among the variables included in the ARDL model. Consequently, the null hypothesis of no cointegration is rejected, confirming the existence of a long-term relationship among the variables. This finding suggests that despite short-term fluctuations, the variables move together over the long term.
Table 3
ARDL Bound test cointegration results
Test Statistic | Value | Significance | I (0) | I (1) |
F-statistic | 9.449 | 10 % | 1.99 | 2.94 |
5 % | 2.27 | 3.28 | ||
1 % | 2.88 | 3.99 |
Based on World Bank data; AIC selection criterion (3,2,1,1,2,2,1) for optimum lag selection.
ARDL estimated results
The ARDL estimation results, presented in Table 4, show the long- and short-run dynamics influencing GDP per capita in Russia. In the long run, youth unemployment exhibits a strong negative association with GDP per capita, reflecting inefficiencies in the labour market and the underutilization of human capital. Both trade openness and FDI show no significant long-term impact on economic growth, likely due to structural challenges such as heavy reliance on energy exports and institutional barriers.
Military spending demonstrates a significant negative relationship with GDP per capita, suggesting that high defense expenditures may divert resources from critical sectors such as infrastructure, education, and technology, which are essential for sustainable growth. Conversely, the real effective exchange rate has a positive long-term association with GDP per capita, indicating that exchange rate appreciation enhances consumer purchasing power and reduces import costs, thereby supporting economic growth. Inflation, on the other hand, shows a negative association with GDP per capita, emphasizing the detrimental effects of price instability on purchasing power and investment.
Youth unemployment continues to negatively affect GDP per capita in the short run, emphasizing its immediate adverse economic consequences. While trade openness and FDI are insignificant in the long run, they exhibit positive short-run effects, displaying their role in stimulating economic activity through exports and investment inflows. Similarly, the real effective exchange rate exerts a significant short-run influence, supporting domestic demand and contributing to economic growth. In the short run, approximately 44 % of deviations from the long-term equilibrium are corrected each period, as indicated by the error correction term. This reflects the economy’s capacity to adjust toward its long-term equilibrium following short-term shocks.
Table 4
Estimated coefficients from the ARDL model
Long Run | Coefficient | Std.Error | t-statistic | Prob. |
Yunemp | − 0.164*** | 0.035 | − 4.611 | 0.002 |
Top | − 0.004 | 0.023 | − 0.155 | 0.880 |
Milsp | − 0.602** | 0.184 | − 3.267 | 0.011 |
Reer | 1.654** | 0.637 | 2.597 | 0.032 |
Infl | − 0.552*** | 0.117 | − 4.708 | 0.002 |
FDI | − 0.001 | 0.048 | − 0.011 | 0.991 |
Constant | 8.296* | 4.035 | 2.055 | 0.073 |
Short Run | ||||
DGDPpc (− 1) | − 0.207* | 0.102 | − 2.019 | 0.078 |
DGDPpc (− 2) | − 0.700*** | 0.083 | − 8.400 | 0.000 |
DYunemp | − 0.027*** | 0.004 | − 6.244 | 0.000 |
DYunemp (− 1) | 0.034*** | 0.006 | 5.086 | 0.001 |
DTop | 0.031*** | 0.004 | 6.978 | 0.000 |
DMilsp | 0.049 | 0.003 | 1.593 | 0.149 |
DReer | 2.128*** | 0.014 | 14.787 | 0.000 |
DReer (− 1) | 0.331** | 0.136 | 2.426 | 0.042 |
DInfl | − 0.130*** | 0.017 | − 7.576 | 0.000 |
DInfl (− 1) | 0.114*** | 0.022 | 4.970 | 0.001 |
DFDI | 0.038*** | 0.007 | 4.773 | 0.001 |
ECT (− 1) | − 0.442*** | 0.037 | − 11.905 | 0.000 |
Diagnostic test | ||||
c2 Reset | 0.405 | 0.698 | ||
c2 Normality | 1.014 | 0.602 | ||
c2ARCH | 0.011 | 0.915 | ||
c2 Serial correlation | 2.461 | 0.165 | ||
Significance codes: ***1 %, **5 %, *10 %; AIC (3,2,1,1,2,2,1); R2 = 0.98; R2 Adjusted = 0.97; DW = 2.516; c2 Normality, normality test for residuals, c2 Serial, LM serial correlation test, c2 Arch, autoregressive conditional heteroscedasticity, c2 Reset, Ramsey reset test. The probability values are provided in parentheses.
Based on World Bank data.
Stability diagnostic test
The diagnostic tests conducted on the ARDL model, as shown in Table 4, indicate that the model is well-specified and reliable. The Ramsey RESET test confirms that there are no issues with model misspecification, validating the functional form and ensuring that no important variables have been omitted. The normality test demonstrates that the residuals (the differences between the observed and predicted values) follow a normal distribution, which is essential for drawing valid statistical inferences. The ARCH test indicates the absence of heteroskedasticity, confirming that the variance of the error terms remains constant over time. Additionally, the serial correlation test shows no evidence of autocorrelation in the residuals, ensuring that the error terms are independent from one period to another.
The recursive cumulative sum (CUSUM) and recursive cumulative sum of squares (CUSUMSQ) tests were performed to evaluate the stability of the estimated coefficients and residuals over time. These tests assess whether the model remains stable by checking for structural breaks or changes in the coefficients and variance of the residuals. The results, shown in Figures 3 and 4, indicate that the CUSUM and CUSUMSQ lines fall within the critical bands, suggesting no significant deviations from stability. This finding confirms that the ARDL model is stable and reliable for analyzing the long-run and short-run relationships among the variables.
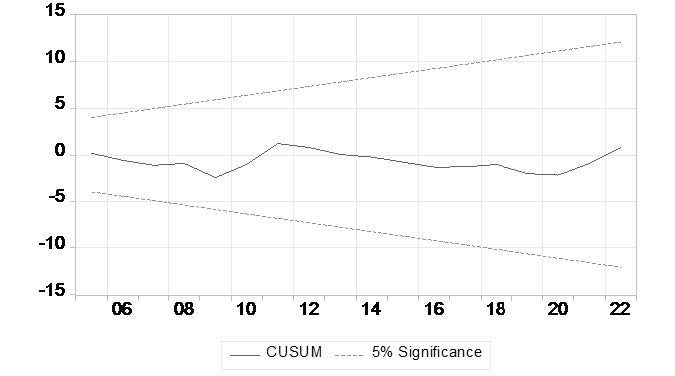
Fig. 3. Cumulative sum of recursive residuals
Based on World Bank data.
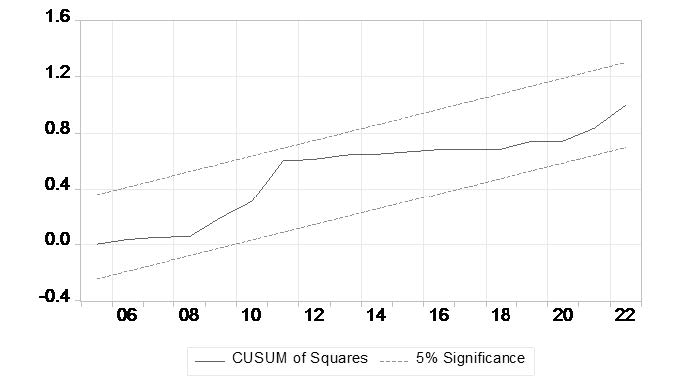
Fig. 4. Cumulative sum of squares of recursive residuals
Based on World Bank data.
Granger causality test
The Granger causality test results in Table 5 provide details on the causal relationships among variables within the Russian economy. The analysis reveals that past values of the youth unemployment rate and GDP per capita do not significantly predict changes in each other, indicating no causal relationship between these variables. For trade openness, past values do not significantly predict changes in GDP per capita. However, GDP per capita has significant predictive power for changes in trade openness, suggesting a unidirectional causality from economic performance to trade activity. Regarding military spending, past values of military expenditures do not significantly predict changes in GDP per capita. In contrast, past GDP per capita values significantly predict changes in military spending, showing the influence of economic performance on defense expenditures.
The results for the real effective exchange rate show that past values of REER do not significantly predict changes in GDP per capita. However, past GDP per capita values significantly predict changes in REER, indicating a one-way causal relationship from economic output to exchange rate movements. In the case of the inflation rate, neither past values of inflation nor GDP per capita significantly predict changes in each other, suggesting no causal relationship between these two variables. Lastly, the findings for FDI reveal that neither past values of FDI nor GDP per capita significantly predict changes in each other, indicating the absence of a causal relationship between these variables.
Table 5
Granger causality test results
Null Hypothesis | F-Statistic | Prob. | Decision |
Yunemp ↛ GDPpc | 0.732 | 0.491 | Not rejected |
GDPpc ↛ Yunemp | 0.901 | 0.419 | Not rejected |
Top ↛ GDPpc | 2.061 | 0.150 | Not rejected |
GDPpc ↛ TOP | 6.631 | 0.005 | Rejected |
Milsp ↛ GDPpc | 0.731 | 0.492 | Not rejected |
GDPpc ↛ Milsp | 3.845 | 0.036 | Rejected |
Reer ↛ GDPpc | 1.922 | 0.169 | Not rejected |
GDPpc ↛ Reer | 9.343 | 0.001 | Rejected |
Infl ↛ GDPpc | 0.222 | 0.802 | Not rejected |
GDPpc ↛ Infl | 0.377 | 0.689 | Not rejected |
FDI ↛ GDPpc | 0.317 | 0.731 | Not rejected |
GDPpc ↛ FDI | 0.779 | 0.470 | Not rejected |
Based on World Bank data.
Discussion
The results show major factors shaping GDP per capita in Russia. The negative association between youth unemployment and economic growth reflects inefficiencies in the labour market, such as skill mismatches and underutilized human capital. This finding is consistent with research by Giovanni et al. [73] and Baah-Boateng [74], who observed similar challenges in other economies. Reducing youth unemployment in Russia could enhance economic performance and labour market efficiency. The lack of a significant long-term effect of trade openness on GDP per capita challenges theoretical expectations that trade liberalization directly fosters growth through access to international markets. Similar results have been documented by Zakaria and Bibi [75], Amiti and Konings [76] and Guris and Gozgor [48], who found that trade benefits depend on institutional quality and the structure of the economy. In Russia’s case, a reliance on energy exports and limited diversification appear to limit the broader economic benefits of trade openness.
The absence of a measurable long-term impact of FDI on GDP per capita aligns with findings by Hayat [77], Peres et al. [78], Nistor [68] and Sabir et al. [70]. Barriers such as institutional inefficiencies, regulatory challenges, and geopolitical factors, including sanctions, likely discourage sustained foreign investment. These constraints reduce the potential of FDI to drive significant economic growth in Russia. The negative relationship between military spending and GDP per capita suggests that high defense expenditures divert resources away from sectors critical for long-term growth, such as infrastructure, education, and technology. This aligns with Desli and Gkoulgkoutsika [79], Azam [80], d’Agostino et al. [81], Phiri [82], Kollias et al. [83] emphasized the trade-offs between military budgets and development investments. The positive association between the real effective exchange rate and GDP per capita indicates the benefits of a stable currency. Exchange rate appreciation appears to boost purchasing power and reduce import costs, supporting domestic economic activity. These results are consistent with observations by Zhang and Zhang [84] and Guzman et al. [85]. However, risks related to exchange rate volatility and its impact on export competitiveness remain an important consideration.
The negative effect of inflation on economic growth emphasizes its role in reducing purchasing power and discouraging investment. This result aligns with the findings of Doan Van [86], Mohseni and Jouzaryan [87] and Hami [88], Kryeziu and Durguti [89], Tenzin [90], who noted similar patterns in other emerging economies. Effective policies to manage inflation are essential for promoting economic stability and growth in Russia. In the short term, trade openness and FDI exhibit positive effects on GDP per capita, suggesting their importance in addressing immediate economic challenges. The error correction mechanism indicates that the economy adjusts quickly to deviations from its long-term growth trajectory, demonstrating its ability to maintain stability despite short-term disruptions.
Conclusion
This study examined the relationship between foreign direct investment (FDI) and trade openness in the Russian economy, utilizing annual time series data from 1993 to 2022 and applying the Autoregressive Distributed Lag (ARDL) bounds testing approach. The short-run analysis reveals that both FDI and trade positively influence economic activities in Russia. However, in the long run, neither FDI nor trade demonstrates a significant impact on the economy. Supporting variables, such as the real effective exchange rate, have a positive influence on economic growth in both the short and long run. The youth unemployment rate shows mixed effects, with both positive and negative impacts in the short run, but a consistent negative influence on economic growth in the long run. Military spending has no short-run effect but exhibits a long-term negative relationship with GDP per capita, suggesting resource misallocation. Similarly, the inflation rate displays mixed effects in the short term and a negative association with economic growth in the long term. The Granger causality test shows unidirectional relationships between economic growth, trade openness, military spending, and the real effective exchange rate.
Based on the study’s findings, some policy recommendations emerge. First, policies designed to attract foreign investment and encourage trade could stimulate economic activity in the short term. Maintaining a competitive exchange rate and ensuring currency market stability would further support economic growth, as evidenced by the positive impact of the real effective exchange rate. Additionally, targeted measures to address youth unemployment, such as skill development programs and support for youth entrepreneurship, are essential for mitigating long-term unemployment challenges. Policymakers should also reassess defense budgets to ensure that excessive military expenditures do not detract from critical investments in infrastructure, education, and technology. Lastly, implementing sound monetary policies to maintain inflation within manageable limits is crucial for economic stability and sustainable growth.
This study acknowledges certain limitations. The reliance on annual time series data may not fully capture short-term fluctuations or the dynamic nature of relationships between variables. Additionally, while the ARDL approach provides robust results, it may not account for all potential interactions among variables. Alternative econometric models could yield different outcomes. Furthermore, the findings are specific to the Russian economy and may not be directly transferable to other countries or regions. External factors, such as geopolitical tensions and global economic conditions, may also affect the relationships among variables and were not comprehensively addressed in this analysis.